Thermal Image
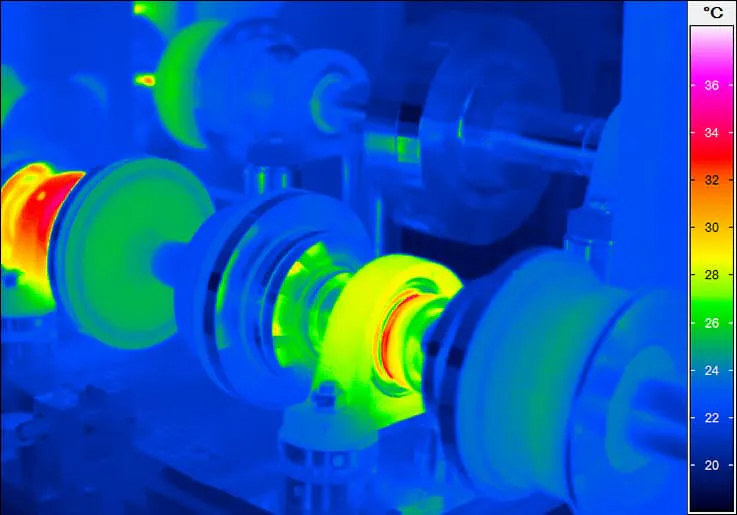
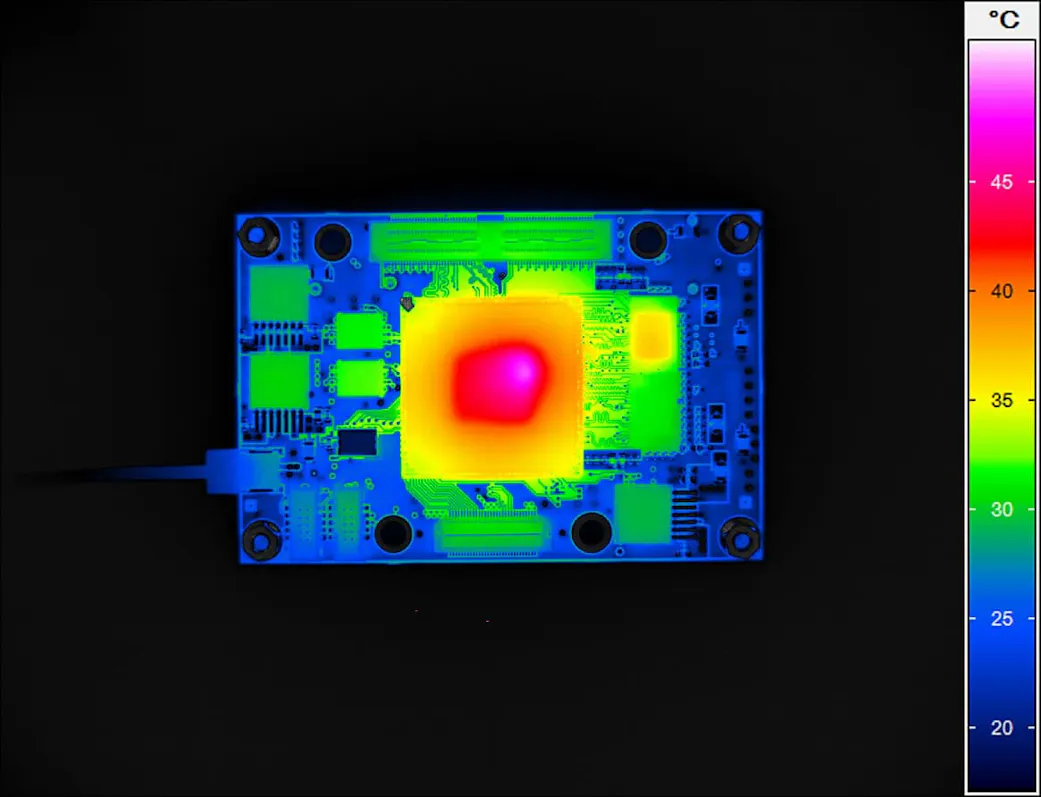
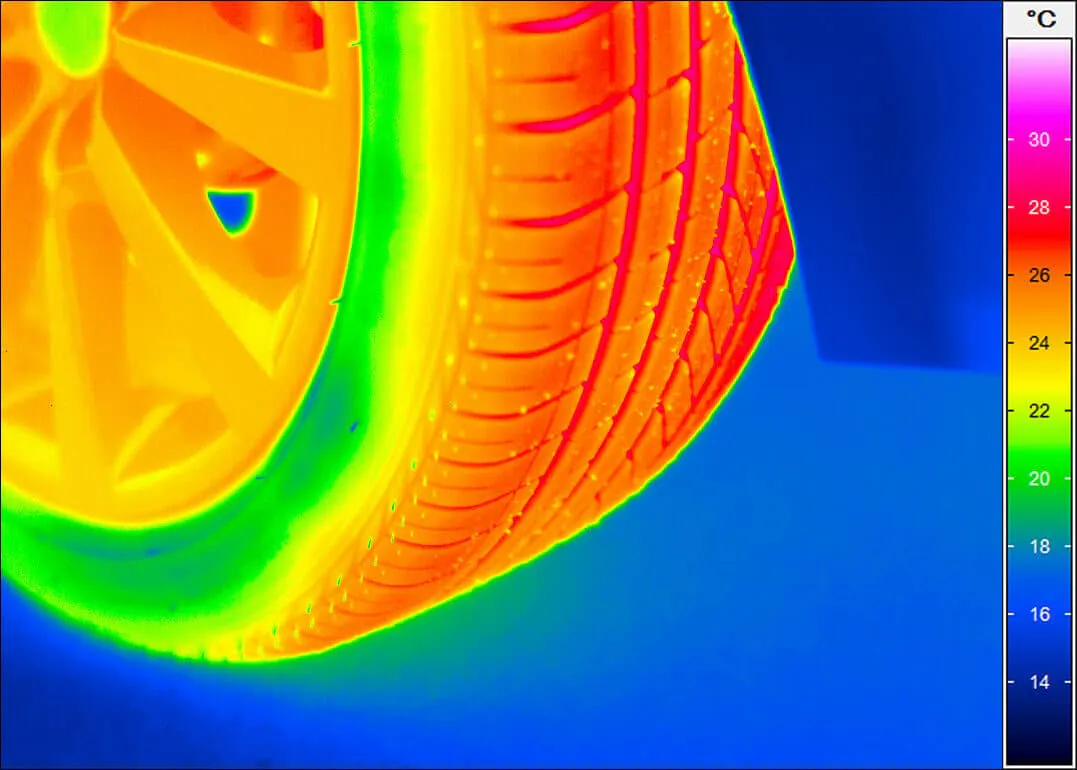
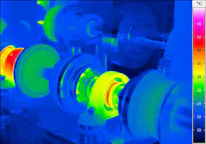
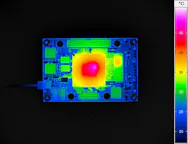
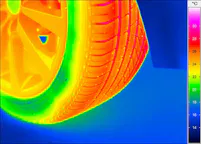
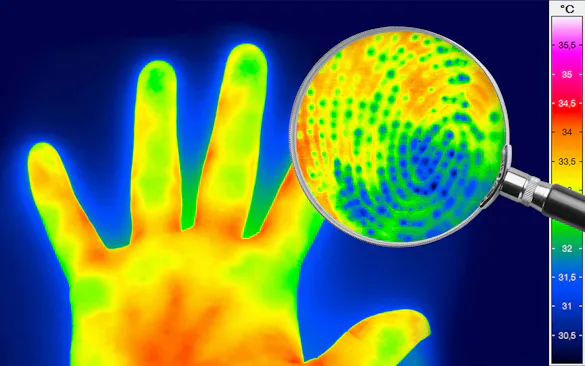
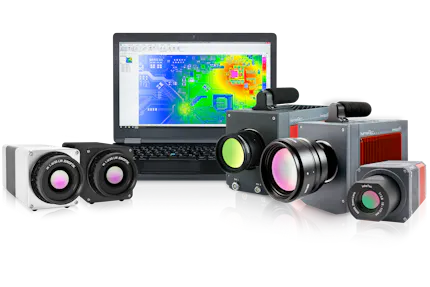
A thermal image can be captured with a infrared camera. To acquire the thermal image, the infrared radiation, which is generated by the heat of an object, is recorded by a thermographic camera. Every object with a temperature higher than absolute zero emits infrared radiation, which is invisible to the human eye.
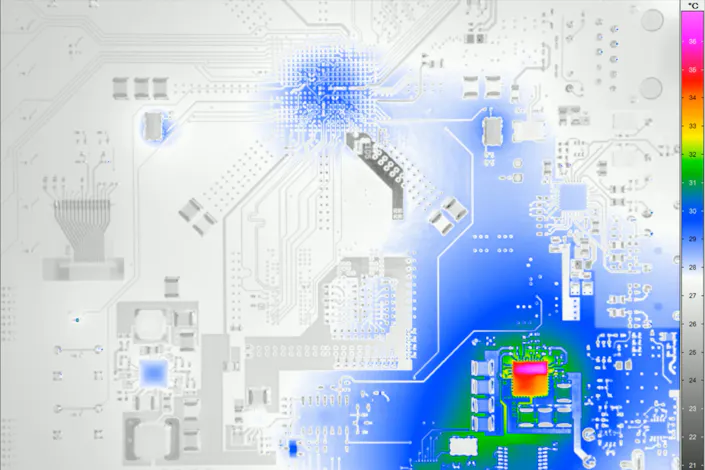
Displaying Temperature Distribution by Means of a Thermal Image
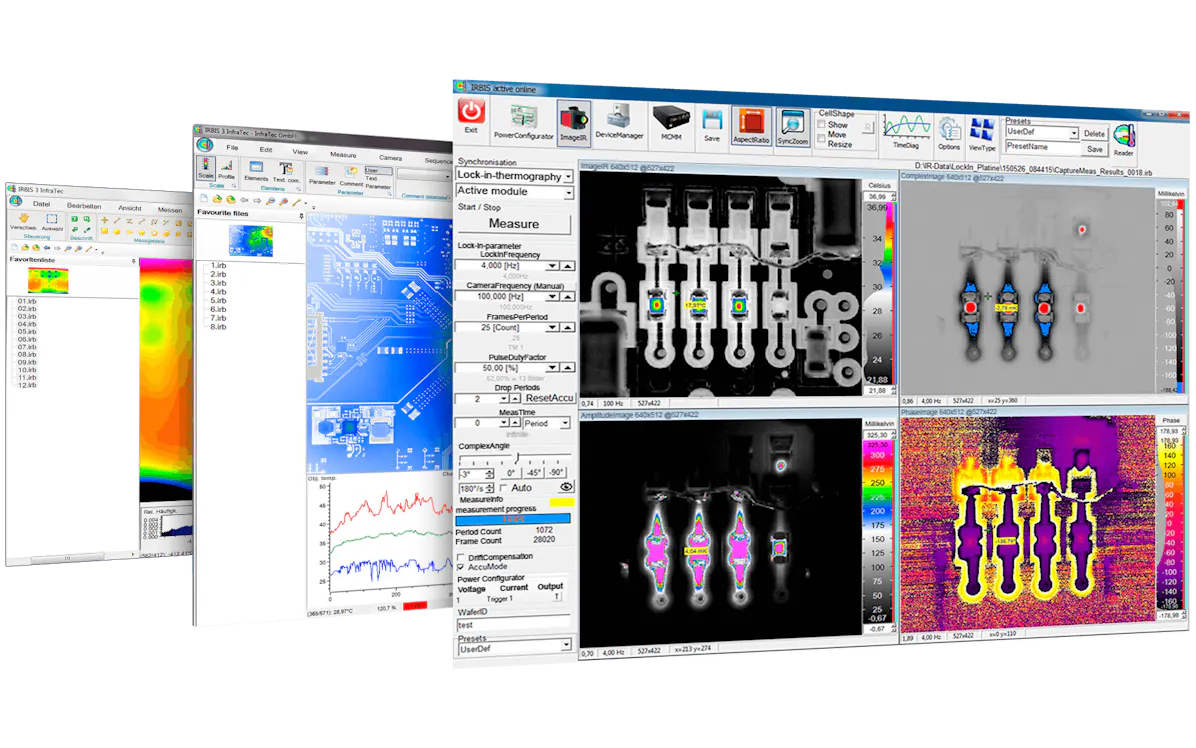
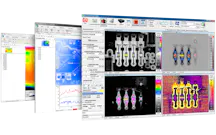
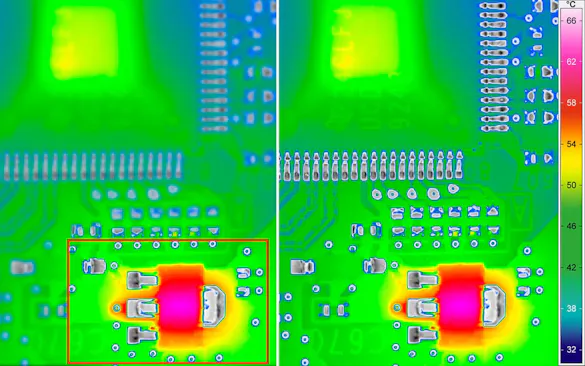
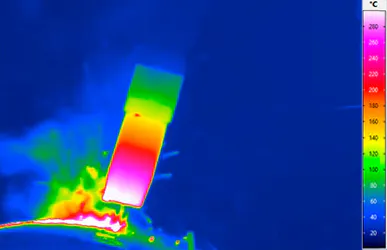
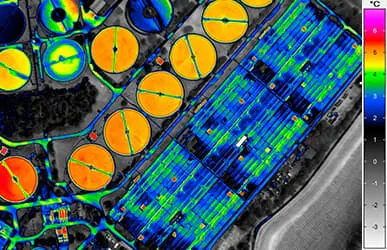
With the aid of the software series IRBIS® 3 by InfraTec you can evaluate and document thermal images effectively and comfortably. These thermograms are displayed in a so-called false colour image. A specific temperature is assigned to every point on the thermogram. The temperatures are then displayed as a specific colour, which is determined by the selected colour palette. Numerous operations to evaluate thermographic images are available, for instance the designation of measurement fields, the display of temperature profiles or the display of minimum and maximum temperatures.
Optimisation of Thermal Images
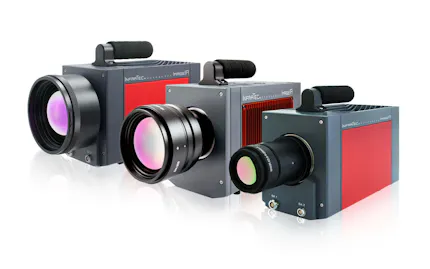
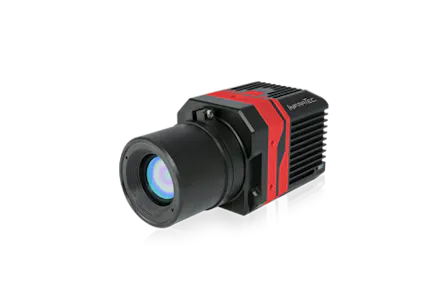
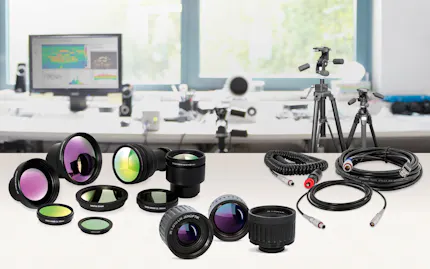
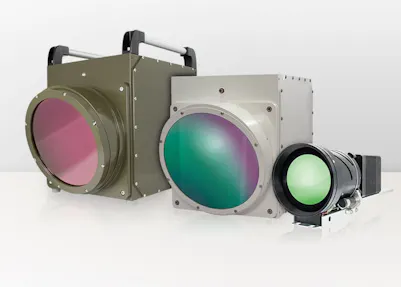
The combination of the detector used, geometric and thermal resolution and high-intensity precision optics enables highly precise and razor-sharp thermal images. The greater the geometric resolution of the detector, the more pixels the thermal image contains. InfraTec offers a wide range of high-resolution products in its camera range.

Would You Like to Know More?
It is not unusual for tasks to be associated with special requirements. Discuss your specific application needs with our specialists, receive further technical information or learn more about our additional services.
Send request
Further Information about Thermal Images
Extensive evaluation is possible with further features and options. The modular software concept of the IRBIS® 3 series allows an individual and customised software layout for every application field and is therefore suited for the universal evaluation of all different types of thermal images. Multiple software packages, tailored for different performance levels, are available: IRBIS® 3, IRBIS® 3 plus and IRBIS® 3 professional.
InfraTec also offers an evaluation package for thermographic construction analysis by means of thermal investigation with the software FORNAX 2. This package is based on an implemented material- and climatic database and therefore allows extensive construction calculations and evaluations.
