Monitoring the Surface Temperature on Curing Epoxy Resin Samples
Epoxy resin systems are mostly used as a matrix material in fibre composites. In a variety of manufacturing processes, the corresponding resin system is processed in a flowable state. The material only acquires its rigidity in a subsequent curing process. This is characterized by an exothermic chemical reaction with a pronounced temperature dependence.
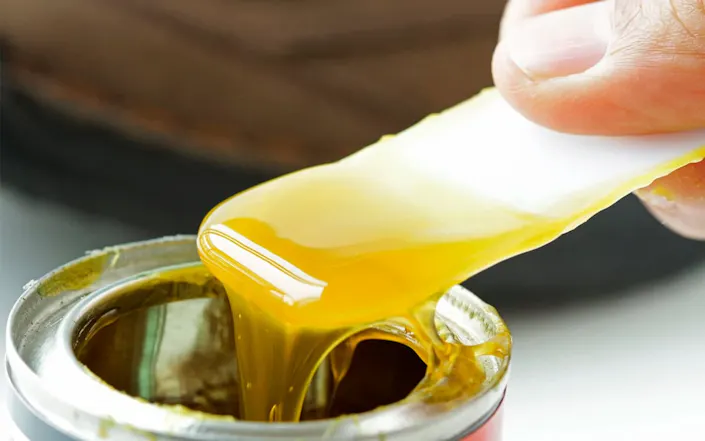
During the curing process, a polymer with a strongly cross‐linked structure – also called a thermoset – is formed. Polymers generally have low thermal conductivity. Particularly in the case of thick‐walled components, these properties lead to an inhomogeneous temperature distribution with hotspots. This entails the risk that the material properties of the polymers deteriorate, for example, their strength decreases, porosity increases, or they even ignite. In addition, the cross‐linking curing reaction of epoxy resins is accompanied by a volumetric shrinkage of the material. This can sometimes cause strong mechanical residual stresses in the material, which can lead to the failure of the component before the actual loading. A precise numerical prediction of the temperature development in components is essential in order to develop suitable temperature controls in the manufacturing process of fibre composite components.
InfraTec Solution
Clausthal University of Technology Institute of Applied Mechanics
Dipl.‐Ing. Leistner, Chris; Prof. Dr.‐Ing. Hartmann, Stefan
www.itm.tu-clausthal.de
Infrared camera
VarioCAM® HD research 800
The Institute of Applied Mechanics of Clausthal University of Technology develops mathematical models based on a wide range of experimental studies. These material models reflect the mechanical, thermal, and in this case, the chemical behaviour of the polymer. Implemented in finite element software, they enable the prediction of the process or component behaviour. Against the background of the aforementioned challenges to process control in the production of fibre composite components, Dipl.‐Ing. Chris Leistner and his colleagues at the Institute of Applied Mechanics, among other topics, examined the pure epoxy resin system as part of their tests. They use temperature measurements on epoxy resin samples during curing in order to validate the model.
Self‐developed Measurement Scenario
The curing of epoxy resin systems is often monitored by a contact temperature measurement. Temperatures inside the component can be recorded by thermocouples, but can only be determined locally. In addition, such methods always have an influence on the measurement object. Thermography systems, on the other hand, measure non‐reactive and provide detailed surface temperatures. This qualifies them excellently for model validation when using hot‐curing epoxy resin samples.
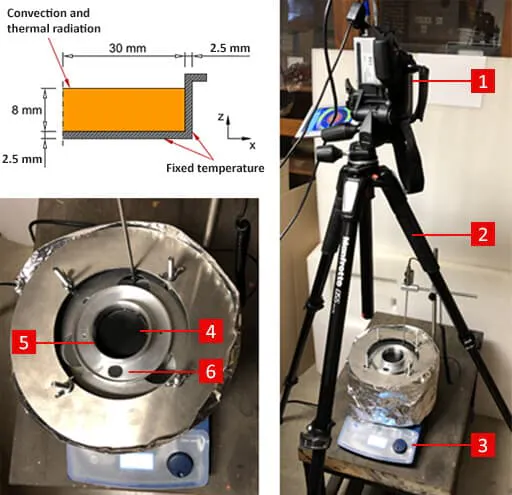
"We have developed a special test setup for this application," says Dipl.‐Ing. Chris Leistner. "In addition, the geometry and the boundary conditions of the experiment must be specified as precisely as possible." The scientists use a cylindrical sample container made of aluminium as a cavity, which is filled with a previously mixed epoxy resin system (see Fig. 1). The heat supply required for the curing takes place via the outer surfaces of the aluminium container. To ensure a temperature that is as constant as possible on these surfaces, the sample container is embedded in an aluminium block preheated to a fixed temperature, which serves as a heat accumulator. Heat‐conducting paste, applied to the contact surfaces, lowers the thermal transfer resistance between the two parts. The thermography system is aligned at right angles to the surface of the epoxy resin sample by means of a tripod (see Fig. 1). The measurement of the surface temperature requires a clear view. Thus, convection and thermal radiation are present as a boundary condition of the surface.
Monitoring the Surface Temperature on Curing Epoxy Resin Samples
Figure 1 - Test Setup
The test setup should ensure, firstly that the sample is heated evenly by the surrounding metal block, and secondly, that the infrared camera captures the sample surface at a vertical angle.
1 – Infrared camera VarioCAM® HD research 800
2 – Tripod
3 – Heat source (tempered silicone oil bath with hot plate)
4 – Epoxy sample
5 – Aluminium cavity
6 – Aluminium heat accumulator
Before starting the thermographic temperature measurement, the researchers would like to know the emissivity of the surface. However, this is unknown because it can depend on the curing state of the resin. "Consequently, determining the emissivity would be very complex," says Dipl.‐Ing. Chris Leistner. "Instead, we apply a very thin layer of a polymer film with a known emissivity resistant up to 200 °C on the initially liquid epoxy resin sample. Floating on the epoxy resin system, the film serves as a carrier material for the TETENAL camera varnish. This has been determined by InfraTec with an emissivity of 0.96 in the spectral range of (8 … 14) μm and can be used up to about 200 °C."
The sample prepared in this way is inserted into the aluminium block heated to 100 °C at the start of the measurement. The research team from Clausthal uses the VarioCAM® HD research 800 infrared camera with a 60 mm telephoto lens. The camera is controlled using the IRBIS® 3 infrared software from InfraTec. By applying temperature‐time profiles, the measurements that take place in the calibration range (‐40 … 120) °C at a frame rate of 1 Hz can be tracked in detail.
Analysis of the Measured Surface Temperatures
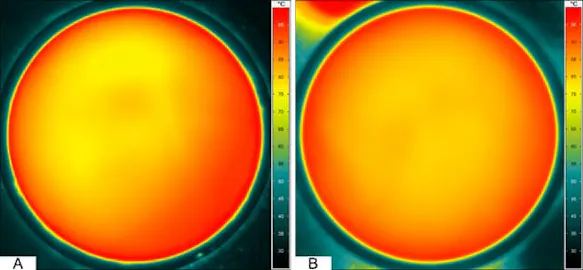
Due to the geometry of the cavity and the boundary conditions, Dipl.‐Ing. Chris Leistner expects an almost rotationally symmetrical temperature distribution over the entire test. Initial results contradict this assumption. The reason for this is also quickly identified. In order to remove the samples from the cavity later, a release agent is used. The thermal images show that the sample detaches from the container wall due to shrinkage and therefore no uniform thermal transfer over the wall is guaranteed. On the other hand, without the use of release agents on the inside of the container, the temperature distribution shows a significantly more pronounced rotational symmetry (see Fig. 2).
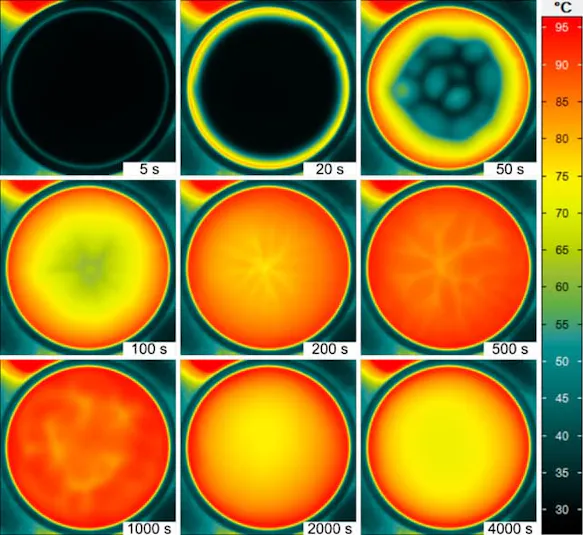
As part of their analyses, the researchers at the Institute of Applied Mechanics initially heat the cylindrical epoxy resin sample starting from the outer surfaces. Due to the thermographic temperature measurement over the entire surface, they detect convective flows in the sample within a short time period, in which the epoxy resin system is still slightly viscous (see Fig. 3). These flows would be difficult to detect in point temperature measurements using thermocouples. The onset of the exothermic reaction causes the temperature to rise at an accelerated rate, so that the maximum temperature within the sample is reached after about 1,000 s. After the sample has completely cured, it cools down again until it reaches a steady state.
Processing of the Thermographic Data (Mapping)
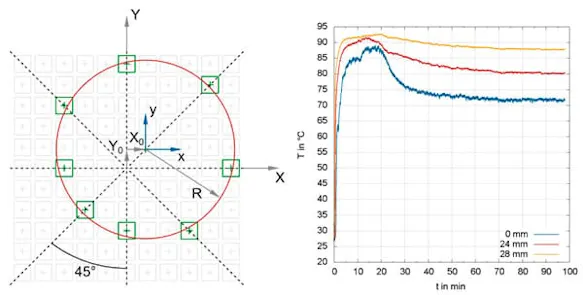
The individual pixel‐related temperature values are related to a geometric coordinate system for the graphic representation of the temperature profiles. "The starting point for this is a pixel coordinate system with X and Y axes, which is thought to be in the middle of an image in the stationary area of the measurement. We determine the maximum temperature on several radial axes,” explains Dipl.‐Ing. Chris Leistner. The aluminium surface of the sample container has a significantly lower emissivity than the sample itself. Due to reflections of the colder environment, lower temperatures are displayed in this area. Consequently, the maximum temperature on the axes defines the edge of the sample. By matching a circle with the searched pixels, the centre and the radius of the circle or the sample itself result.
The centre of the circle defines the geometric coordinate system (x, y). The researchers assign the corresponding geometric coordinate to each pixel by using the ratio of the sample radius to the corresponding number of pixels. Due to the rotational symmetry, the temperature values can be averaged in narrow radial rings around the centre of the sample (see Fig. 4).
Insights into the Temperature Behaviour of Curing Epoxy Resin Samples
With their previous work, the researchers at Clausthal University of Technology have already laid important foundations for thermographic temperature measurement of liquid materials under changing emission levels. It has been shown that infrared thermography in general, and the use of the VarioCAM® HD research 800 infrared camera in particular, provide detailed insights into the temperature behaviour of curing epoxy resin samples. In this way, temperatures can be measured almost with non‐reactive influence on the sensitive and strongly temperature‐dependent curing reaction in epoxy resin samples during curing. In addition, flows in the samples can be detected and boundary conditions can be checked. These findings pave the way for the determination of the thermal transfer coefficient based on actual temperature data and the comparison with empirical values.
Reference
Leistner, C., Löffelholz, M., & Hartmann, S. (2019). Model validation of polymer curing processes using thermography. Polymer Testing, 77, 105893.
