Lock-in Thermography
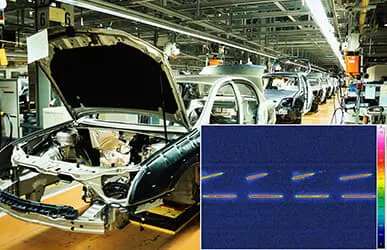
Lock-in Thermography (also abbreviated as LIT or LT) is a special method of active thermal imaging. This measurement method is often used in electrical engineering and electronics to thermally locate faults in semiconductor devices and integrated circuits (ICs). Lock-in Thermography is also used for the inspection of workpieces, for example, to detect subsurface defects such as air inclusions in plastic parts or hidden cracks in weld seams.
In Lock-in Thermography, the object to be analyzed is excited by a periodic, modulated excitation signal, and the thermal response of the test object is evaluated. This non-destructive testing method can detect the smallest temperature differences and provides insights into the near-surface structure of materials.











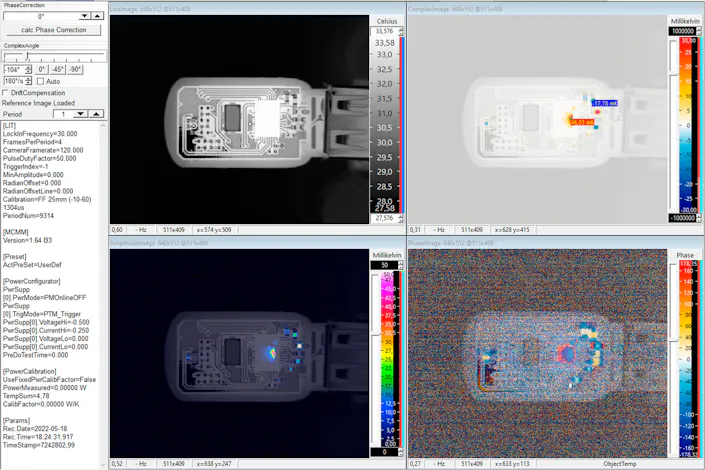
Key Benefits of Lock-in Thermography
The non-destructive testing method preserves the integrity of the test object.
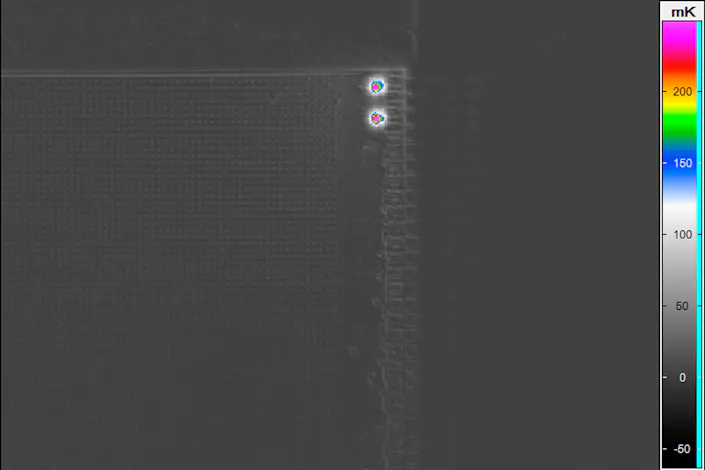
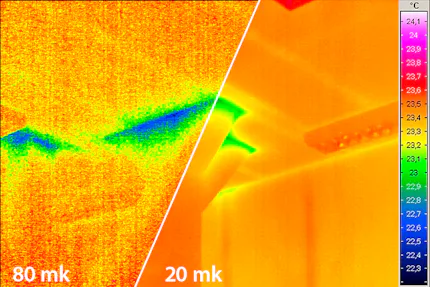
An excellent signal-to-noise ratio and very high thermal resolution (down to the µK range) allow even the smallest material defects to be localized.
The ability to perform thermal analyses in real time significantly increases evaluation speed.
Analysis of stacked chips, where multiple layers of integrated circuits can be evaluated simultaneously.
Effective failure analysis based on amplitude and phase information.
Application of Lock-In Thermography in Electrical Engineering and Electronics
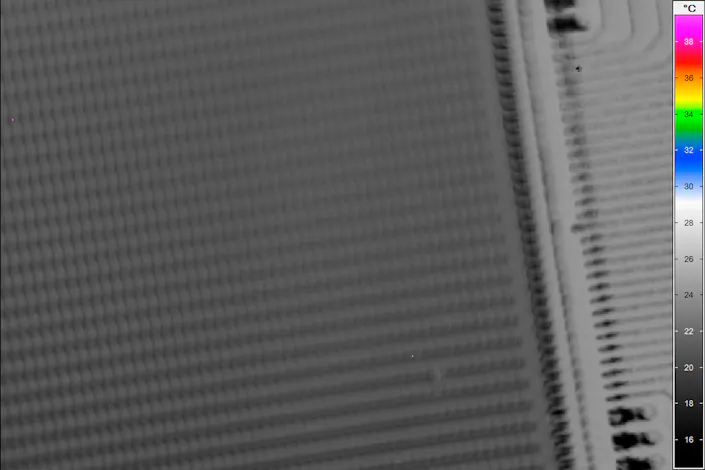
Non-destructive testing of electronic components and assemblies using active thermography is an established method for fault detection and quality assurance used from prototype development to series production. Lock-in thermography, in particular, can provide highly detailed information throughout all these phases. The method, which allows precise detection and localization of defects, is therefore frequently used for efficient failure analysis of complex electronic components.
Recognizable Anomalies in Lock-In Thermography
Handling and manufacturing defects
Point and line short circuits
Oxidation defects
Faults in active and passive components
Defects in stacked-die-packages and multi-chip modules
The information obtained contributes significantly to improving the reliability of electronic components.
Applications of Lock-In Thermography
Optimizing thermal management in the design of complex electronic circuits or assemblies
Quality assurance
Continuous monitoring of technological process parameters
Inline product analysis during manufacturing

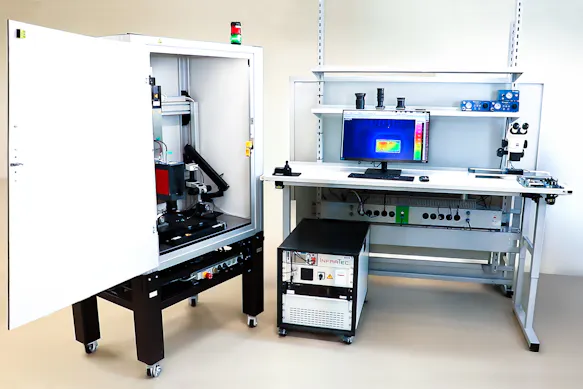
InfraTec Automation Solutions for Lock-in-Thermography
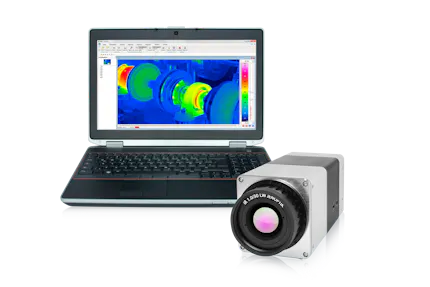
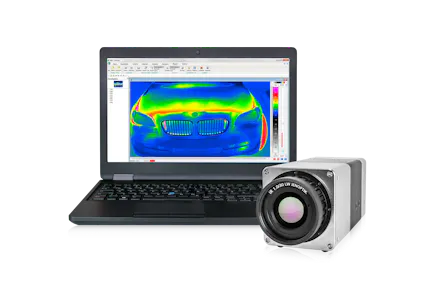
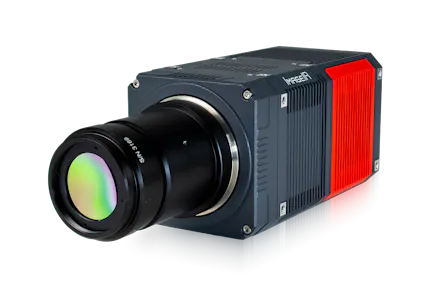
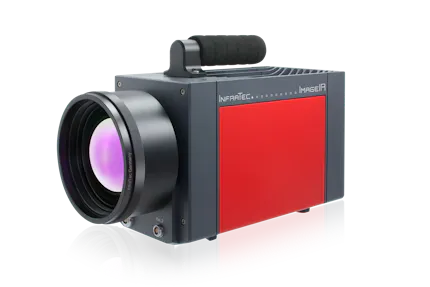
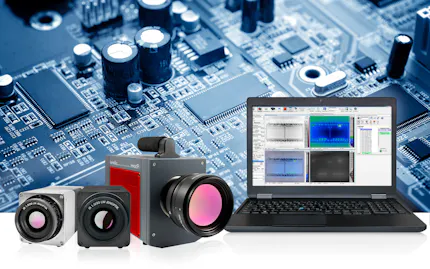
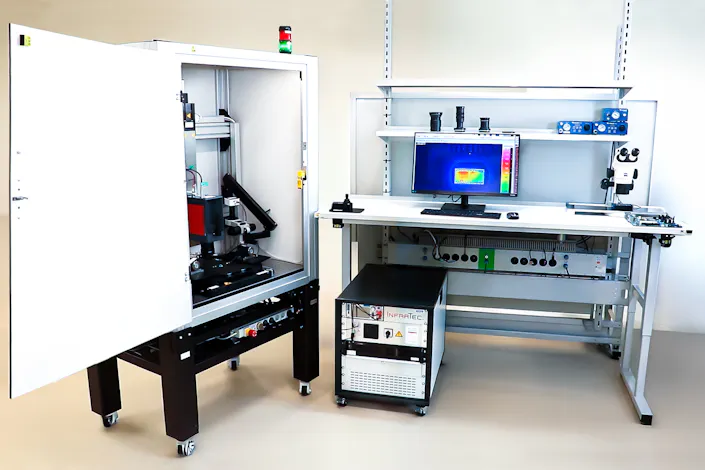
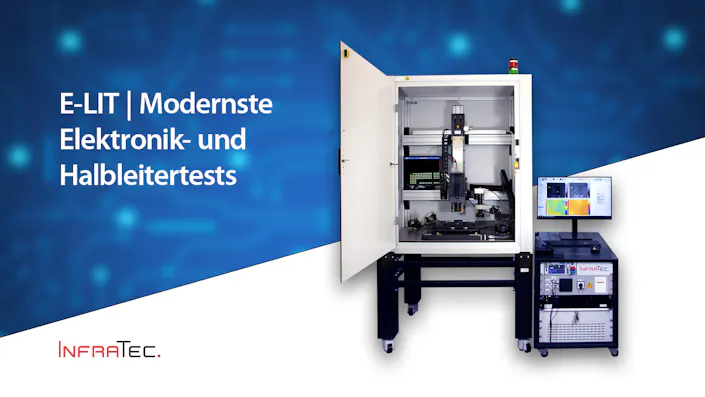
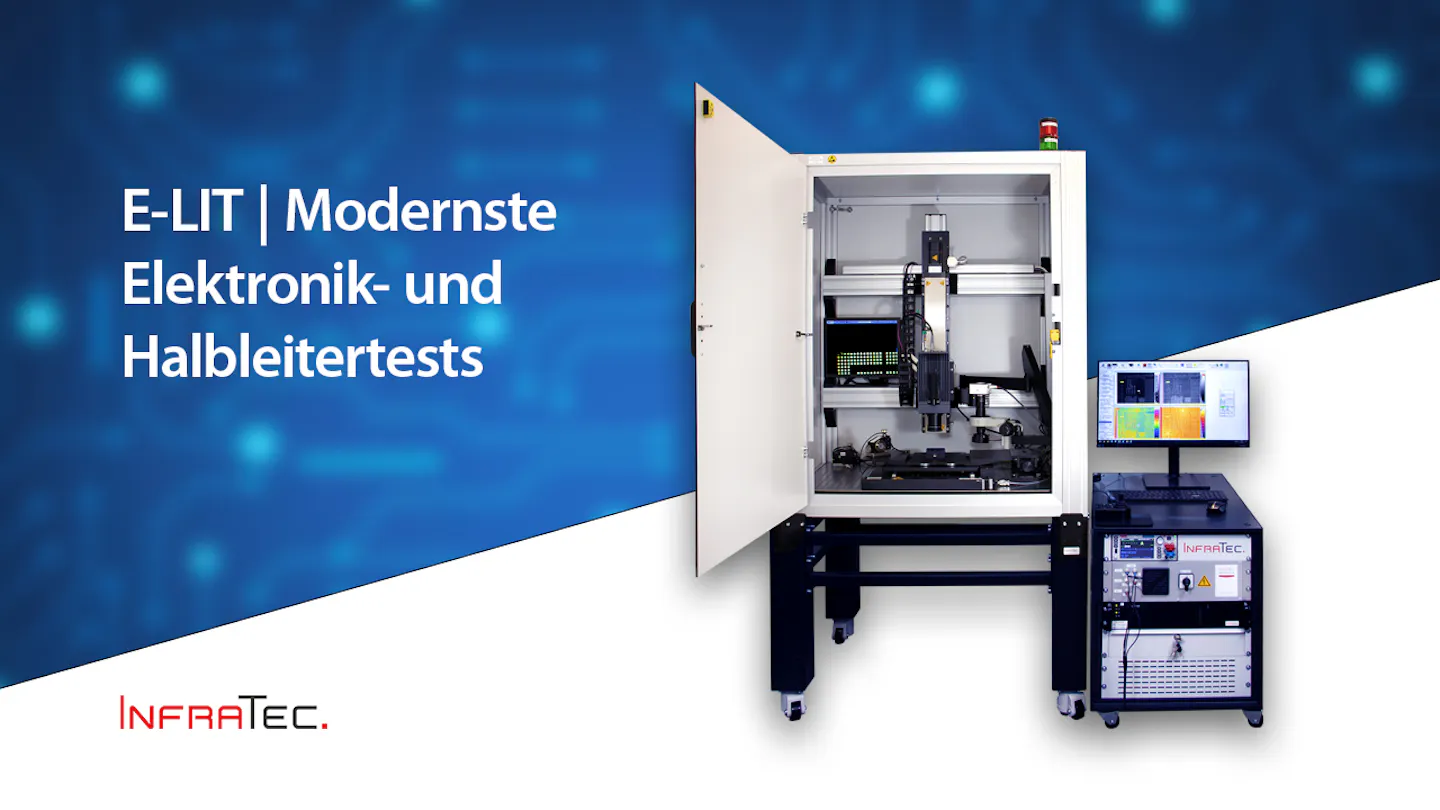
InfraTec offers the E-LIT system, which was developed specifically for analyzing stacked chips. In research and development, it is used, among other things, as a powerful tool for isolating thermal faults and evaluating device failures. Lock-in infrared thermography helps ensure the reliability and performance of electronic components, ultimately improving product quality.
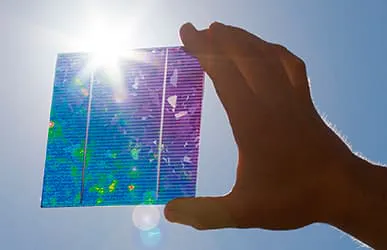
For the analysis of solar cells and photovoltaic modules, InfraTec provides its customers with the PV-LIT system, adapted to the specific requirements of these components.


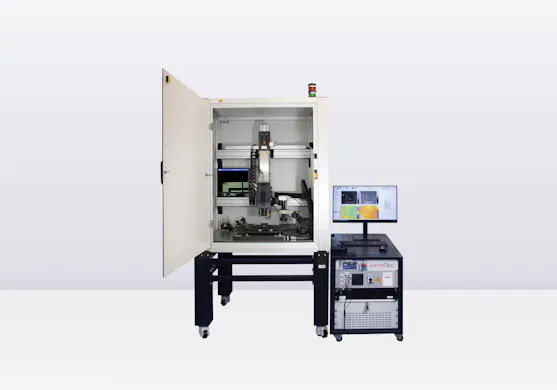


Real-time Lock-in Test Measurement with E-LIT from InfraTec




Would You Like to Know More?
It is not unusual for tasks to be associated with special requirements. Discuss your specific application needs with our specialists, receive further technical information or learn more about our additional services.









How Lock-in Thermography Works
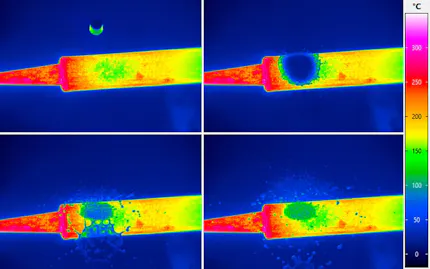
In Lock-in Thermography, the object to be analyzed is excited by a periodic, modulated excitation signal that acts specifically on the surface of the test object. Heat, ultrasound, microwaves, eddy currents, or light (for example, flash, halogen, xenon lamps, lasers) are used for excitation.
The wave is absorbed when it penetrates the test object, causing a phase shift. If the test object contains inhomogeneities such as bubbles, cracks, or inclusions, the wave is partially reflected. The incident and reflected waves overlap, creating an interference pattern of the local surface temperature.
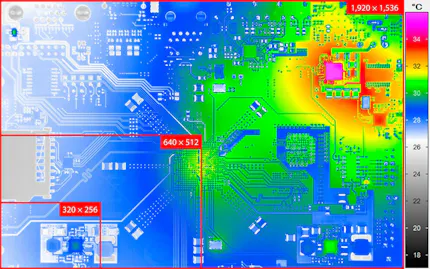
By continuously analyzing the surface temperatures distribution of the test object, conclusions can be drawn about its internal structure. Local temperature increases indicate defects such as oxidation damage, short circuits, or fault currents.


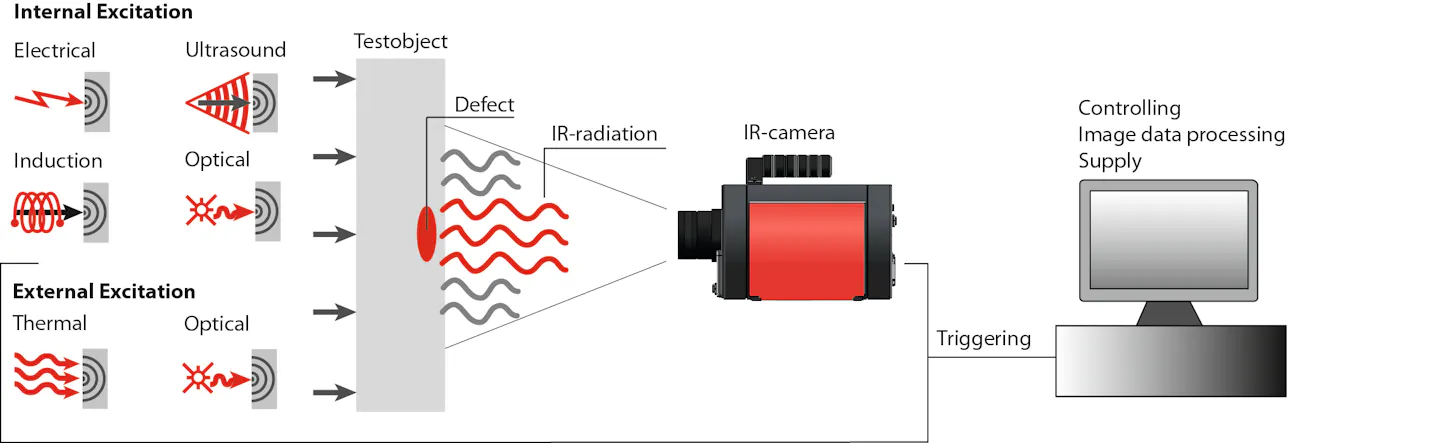
Functional principle of lock-in thermography
Excitation Frequency: The Most Important Parameter in Lock-in Thermography
Excitation frequency is a key factor in Lock-in Thermography. It must be selected according to the thermophysical properties of the object (thermal diffusivity) and its thickness. As the excitation frequency increases, surface temperature differences decrease, and the effective penetration depth of the thermal wave becomes shallower. However, both effects can be compensated for, at least in part, by stronger excitation (higher energy input).
One significant benefit of lock-in techniques is that the frequency remains constant during the measurement process and corresponds to the frequency of the reflected thermal wave. By demodulating the thermal signal at the known excitation frequency, interfering signals can be filtered out and the measurement signal can be isolated. As a result, Lock-in Thermography is characterized by an excellent signal-to-noise ratio, allowing even the smallest temperature differences in the µK range to be measured reliably.


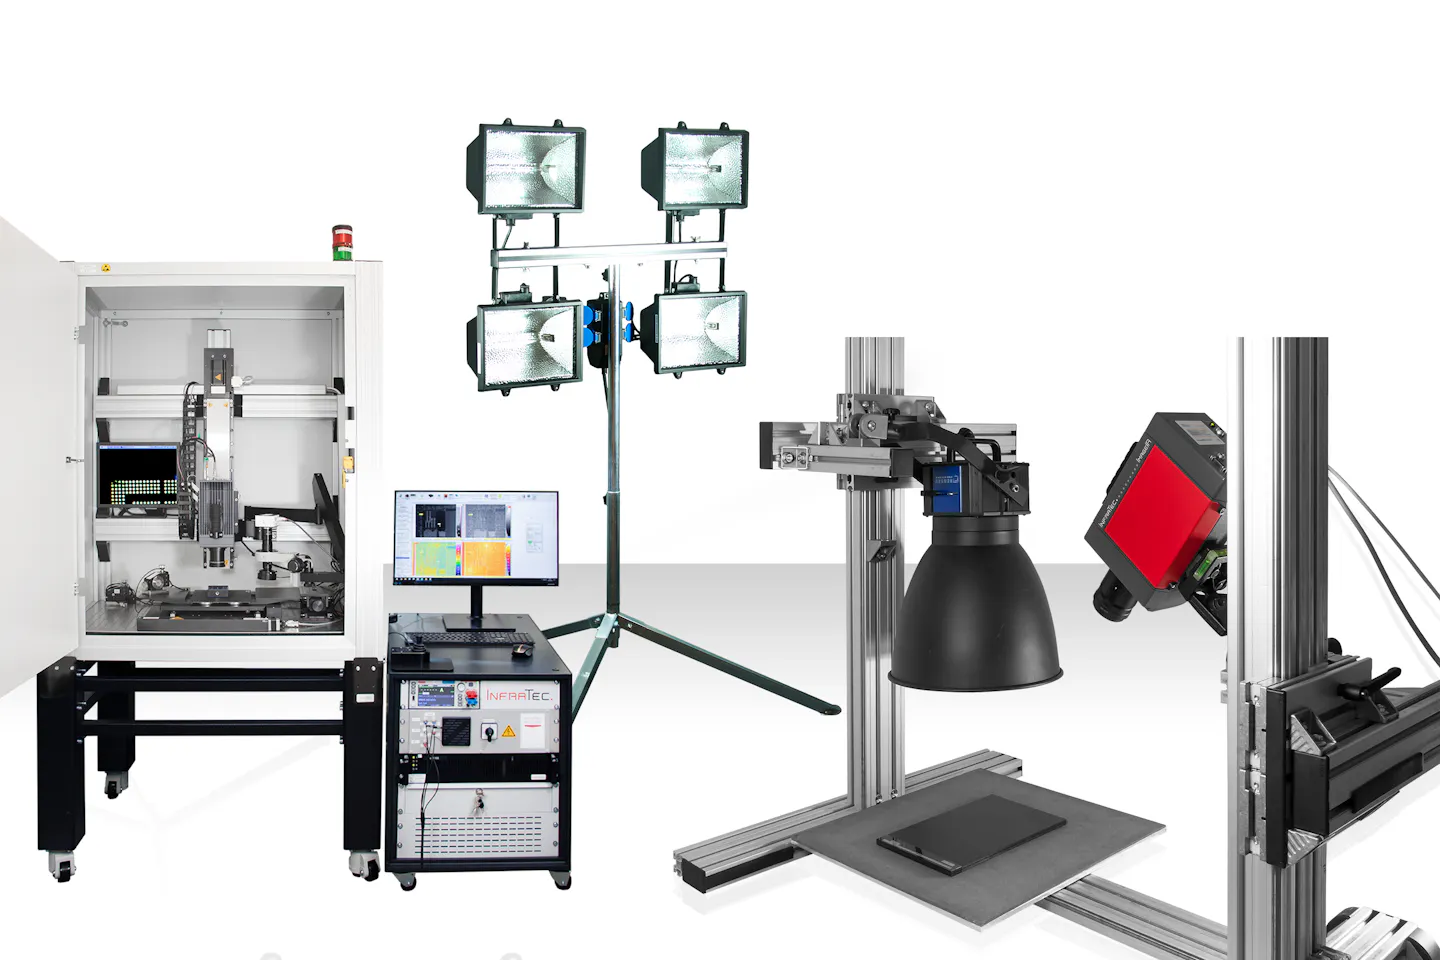
Excitation sources of Lock-in Thermography
Fundamental Influence of Material Properties in Lock-in Thermography
The material and density of a test object significantly influence the propagation velocity of thermal waves and their penetration depth. In active thermography, materials are commonly classified as “fast” or “slow” based on their thermal response.
Heat propagates rapidly in “fast” materials with high thermal diffusivity, such as copper, aluminum, or silicon. However, the rapid heat transport also shortens the available evaluation time. Consequently, high-quality infrared cameras with short integration times are required for such measurements. “Fast” materials are additionally characterized by lower attenuation of thermal waves, which enables the analysis of deeper regions within the material.
In contrast, “slow” materials with low thermal conductivity – such as plastics, ceramics, or wood – exhibit stronger damping of thermal waves, resulting in shallower penetration depths. Nevertheless, defects in these materials often appear with higher contrast during measurement. The penetration depth can be increased by reducing the excitation frequency, within the limits imposed by the material properties.
As with all thermographic techniques, the emissivity of the object surface also affects measurements in Lock-in Thermography. However, compared to passive thermography, Lock-in Thermography is generally more robust with respect to emissivity variations.
Evaluation of Thermographic Analysis
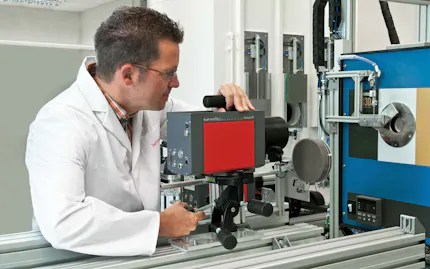
Precise synchronization between the excitation source and the infrared camera is essential for successful Lock-in Thermography. The camera’s sampling frequency must be significantly higher than the excitation frequency to accurately capture the temporal evolution of the thermal signal.
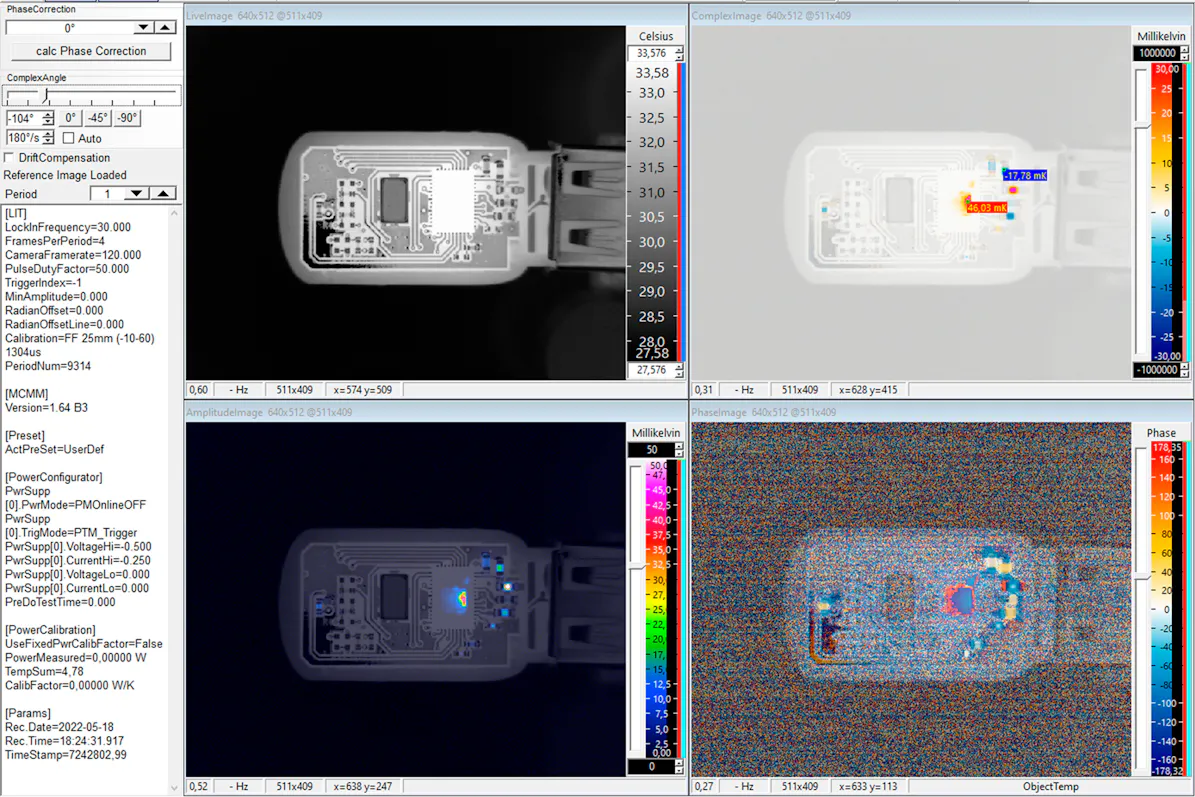
The primary quantities evaluated in Lock-in Thermography are the phase shift of the thermal wave and the amplitude variation as it propagates through the object under investigation. These parameters are computed individually for each pixel of the infrared image.

Phase Image
The phase shift (or time delay) between the excitation signal and the thermal response at the surface is a particularly meaningful parameter. As the depth of a defect increases, the time delay also increases.
However, differences in phase position also allow conclusions to be drawn about the structure of the test object, as materials with different thermal conductivities or densities delay the propagation of heat to varying degrees. For example, delamination or the inclusion of another material (e.g., air, water, resin) can be made visible by a locally altered phase shift.
The measured variable is particularly useful for detecting deep-seated or low-contrast defects. The phase shift is largely insensitive to variations in emissivities, reflections, local differences in surface texture, or uneven heating of the sample – allowing genuine internal defects to be detected with a high degree of reliability.– echte Defekte im Inneren lassen sich somit besonders zuverlässig erkennen.
Amplitude Image
The amplitude provides important information about the properties of the test object. Air gaps, for example, which may occur due to delamination in composite materials, lead to reduced amplitudes because air is a less effective thermal conductor. Inclusions of other materials or material inhomogeneities in the object (for example, coating defects) also cause variations in amplitude. In addition, this measured variable provides important information about the depth of a defect. If the defect is located deeper in the material, the thermal wave is more strongly attenuated, and the measured amplitude decreases.
Complex Image
One benefit of Lock-in Thermography is its high intrinsic robustness. Even if differences in amplitude measurements are small, the phase shift can clearly reveal structural defects or inhomogeneities. To enable accurate interpretations, phase and amplitude images are often combined into a so-called complex image, in which both measured variables are evaluated together.
Development of Lock-In Thermography
Lock-in Thermography was first used in 1988 to analyze microcracks in an electrically heated copper foil on a polyimide substrate.
This measurement method later gained popularity in the non-destructive testing of materials such as fiber-reinforced composites used in aircraft components, as these analyses allow a “look beneath the surface” of such structures. The aim of this and other applications, such as thermoelastic or ultrasound-based Lock-in Thermography, is to detect certain material inhomogeneities in the component under analysis (for example, delamination, missing welds, or hidden cavities).
It was not until after 2000 that Lock-in Thermography was systematically used for non-destructive failure analysis of electronic components such as solar cells and integrated circuits (ICs). The success of LIT in testing electronic components, assemblies, and devices is since they generate heat during operation, thereby creating local heat sources. If certain faults are present in the test objects, these faults usually lead to a change in the heat distribution or to the formation of new local heat sources, which can be reliably detected using Lock-in Thermography.