1. Thermal Imaging
  2. Thermal Images of Freezing Drizzle Droplets

Thermal Images of Freezing Drizzle Droplets

Investigation of Ice Formation Processes

To better understand ice formation processes in the atmosphere, scientists at the Karlsruhe Institute of Technology (KIT) conducted experiments with freezing water droplets. They used a high-resolution ImageIR® 7340 infrared camera and a high-speed camera to precisely document temperature and shape changes during freezing. The aim was to analyze mechanisms by which freezing, drizzle-sized cloud droplets break apart and release ice fragments (known as secondary ice formation), which can trigger the freezing of further droplets.

Freezing Droplets

The experiments were conducted in an electrodynamic trap, where droplets were examined in suspension under controlled conditions of temperature, humidity and air flow. Ice formation was stimulated by the targeted introduction of fine ice particles.

Download case study

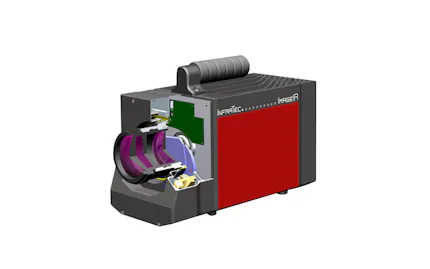
An ImageIR® 7340 MWIR infrared camera with a 50 mm lens, close-up adapter, and extension rings for 2x magnification were used to measure the droplet surface temperature during freezing. The camera offers an accuracy of ±1 K in the temperature range of (-30 … +30) °C and a frame rate of 287 frames/s. The thickness of the emitting layer was 36 µm for water and 24 µm for ice, so that only the outermost layer of the droplet was captured in each case.

InfraTec Solution

Karlsruher Institut für Technik (KIT)
Institute of Meteorology and Climate Research
Atmospheric Aerosol Research (IMK-AAF)
www.imk-aaf.kit.edu

Infrared camera:
ImageIR® 7340

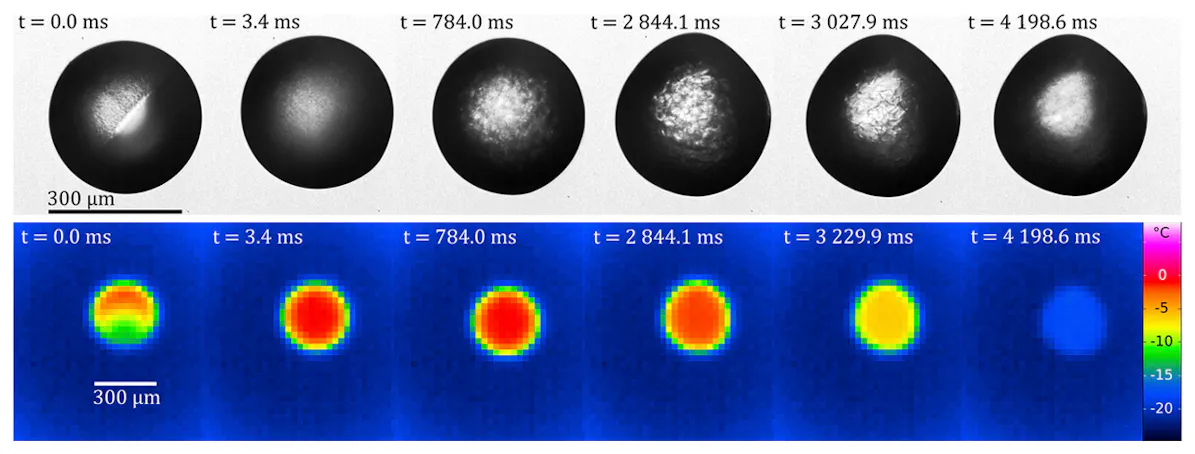
High-speed video recording and (bottom) IR video recording of a freezing droplet (d5344 mm) at2208C in stagnant air. The time indicates milliseconds after ice nucleation. In the bottom panel the surface temperature is color coded.
Fig. 1: High-speed video recording and (bottom) IR video recording of a freezing droplet (d5344 mm) at2208C in stagnant air. The time indicates milliseconds after ice nucleation. In the bottom panel the surface temperature is color coded. from the paper "Thermal Imaging of Freezing Drizzle Droplets: Pressure Release Events as a Source of Secondary Ice Particles", Kleinhans, J., Kiselev, A. et al., published at Journal of the Atmospheric Sciences, May 2021, © American Meteorological Society. Used with permission.

As water and ice are not ideal black bodies in the relevant spectral range and the droplet geometry can affect the measurements, the measurements focused on the central region of the droplet. 

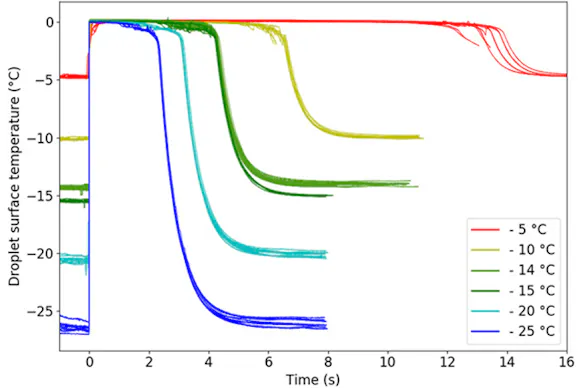
The measurements showed three clearly distinguishable phases (see Fig. 2):

  1. Initial phase: Immediately after the freezing process was initiated by external ice particles, the droplet heats up to the melting temperature of ice (approx. 0 °C) due to the latent heat released during crystallization.

  2. Crystallization phase: As crystallization progresses, the temperature stabilized at this constant level until all the liquid water has solidified.

  3. Cooling phase: After crystallization was complete, the droplet cooled exponentially to the ambient temperature.

Droplet surface temperature during freezing in stagnant air at different ambient temperatures (experiment type A). Time zero is set to the moment of nucleation.
Fig. 2: Droplet surface temperature during freezing in stagnant air at different ambient temperatures (experiment type A). Time zero is set to the moment of nucleation. From the paper "Thermal Imaging of Freezing Drizzle Droplets: Pressure Release Events as a Source of Secondary Ice Particles", Kleinhans, J., Kiselev, A. et al., published at Journal of the Atmospheric Sciences, May 2021, © American Meteorological Society. Used with permission.

Modeling the Cooling Process

A simple heat and mass transfer model was developed to describe the processes, accounting for both complete crystallization (phase 2) and subsequent cooling to ambient temperature (phase 3).

This model takes into account the release of latent crystallization heat, heat conduction inside the droplet, heat transfer to the environment through heat conduction (heat diffusion), free and forced convection, and ice sublimation at the droplet surface.

The cooling of the completely frozen droplet to ambient temperature (phase 3, cooling model) was calculated based on a solid ice sphere at the melting point and under ambient pressure. Overall, the modeled surface temperature corresponds very well to the measured values.

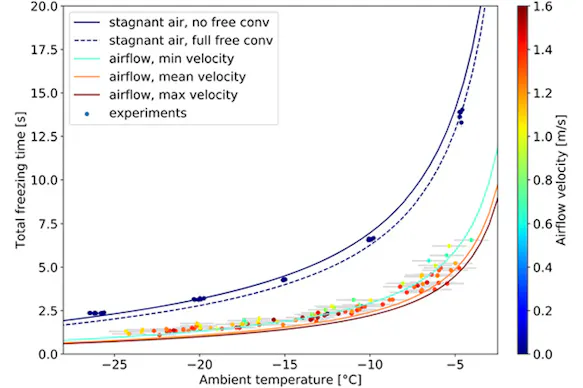
Comparison of modeled (lines) to measured (dots) total freezing time of water droplets of d = 345 +/- 1 µm (stagnant) and d = 326 +/- 6 µm (airflow) as a function of the ambient temperature. All markers and lines are color-coded by the airflow velocity. The solid lines for freezing in airflow were calculated for three limiting cases used in the experiment: minimum, mean, and maximum airflow velocity of 0.6, 1.2, and 1.6 m/s, respectively.
Fig. 3: Comparison of modeled (lines) to measured (dots) total freezing time of water droplets of d = 345 ±1 µm (stagnant) and d = 326 ± 6 µm (airflow) as a function of the ambient temperature. All markers and lines are color-coded by the airflow velocity. The solid lines for freezing in airflow were calculated for three limiting cases used in the experiment: minimum, mean, and maximum airflow velocity of 0.6, 1.2, and 1.6 m/s, respectively. From the paper "Thermal Imaging of Freezing Drizzle Droplets: Pressure Release Events as a Source of Secondary Ice Particles", Kleinhans, J., Kiselev, A. et al., published at Journal of the Atmospheric Sciences, May 2021, © American Meteorological Society. Used with permission.

Investigation of Pressure Release Events (PREs)

High-speed recordings documented events such as fragmentation and bubble formation, which were always accompanied by a slow decrease in temperature and a sudden increase in temperature. This indicates a pressure-induced freezing point depression, followed by a rapid drop in pressure due to cracking in the ice shell (see inset in Fig. 4).

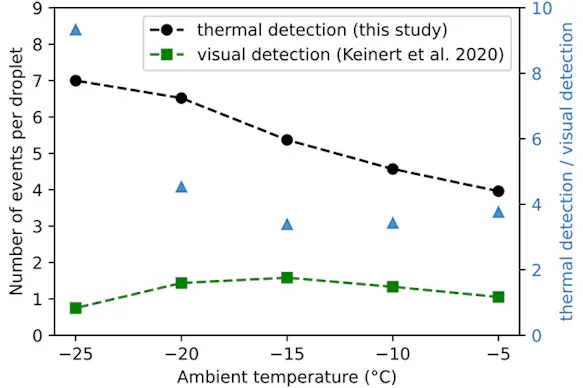
Thermography proved to be significantly more sensitive than high-speed video technology, detecting three to nine times more PREs (see Fig. 5).

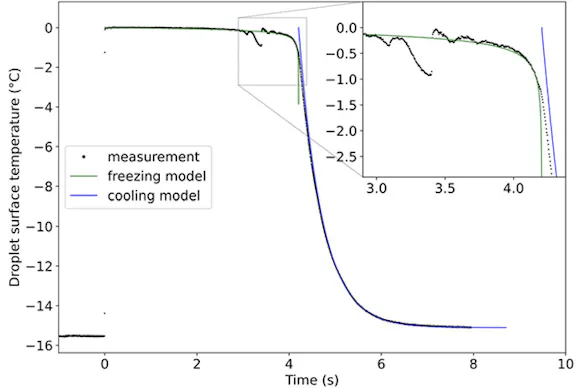
Comparison of two-step modeled surface temperature (green and blue line) to themeasured surface temperature (black dots) of a freezing droplet at -15°C in stagnant air (d=346 µm). In the model, an intermediary Nusselt number of 0.55N no_free_convection + 0.45N full_free_convection was used to meet the actual freezing time.
Fig. 4: Comparison of two-step modeled surface temperature (green and blue line) to themeasured surface temperature (black dots) of a freezing droplet at -15°C in stagnant air (d=346 µm). In the model, an intermediary Nusselt number of 0.55N no_free_convection + 0.45N full_free_convection was used to meet the actual freezing time. From the paper "Thermal Imaging of Freezing Drizzle Droplets: Pressure Release Events as a Source of Secondary Ice Particles", Kleinhans, J., Kiselev, A. et al., published at Journal of the Atmospheric Sciences, May 2021, © American Meteorological Society. Used with permission.
Comparison of different methods to detect the number of pressure release events. Left axis shows the average number of PREs per droplet detected in this study via thermal imaging (black circles) and average number of SIP events observed in Keinert et al. (2020) via high-speed video analysis (green squares). Blue triangles (right axis) show the ratio of the two compared methods.
Fig. 5: Comparison of different methods to detect the number of pressure release events. Left axis shows the average number of PREs per droplet detected in this study via thermal imaging (black circles) and average number of SIP events observed, in Keinert et al. (2020) via high-speed video analysis (green squares). Blue triangles (right axis) show the ratio of the two compared methods. From the paper "Thermal Imaging of Freezing Drizzle Droplets: Pressure Release Events as a Source of Secondary Ice Particles", Kleinhans, J., Kiselev, A. et al., published at Journal of the Atmospheric Sciences, May 2021, © American Meteorological Society. Used with permission.

In free fall, PREs occurred about three times more frequently than in still air, which can be attributed to the freezing process being accelerated by airflow and increased internal pressure. Higher temperatures led to more stable ice shells, while rapid freezing produced more brittle structures.

The study shows that thermography can not only provide precise temperature profiles of freezing droplets but also offer a significantly higher detection rate for pressure-related events (PREs). As these processes contribute to the formation of secondary ice crystals, they are crucial for understanding ice and precipitation formation in mixed-phase clouds.

Scientific source

Kleinheins, J., Kiselev, A., Keinert, A., Kind, M., and Leisner, T. (2021): Thermal Imaging of Freezing Drizzle Droplets: Pressure Release Events as a Source of Secondary Ice Particles, Journal of the Atmospheric Sciences, 78, 1703-1713

Read the full article

Advant­ages of the Ther­mo­graphy Solu­tion for this Applic­a­tion

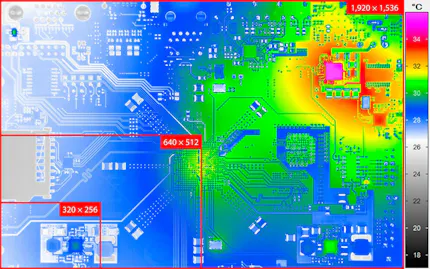
InfraTec thermography - Geometrical Resolution

Geometrical Resolution

Reliable Detection

InfraTec infrared cameras offer high geometrical resolution, enabling detailed thermograms for reliable defect detection and precise localisation.

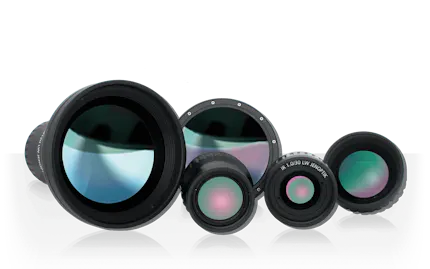
InfraTec Service - thermography lenses

Infrared Lenses

Precision lenses for a Wide Range of Requirements

Whether measuring the smallest details or monitoring over long distances, InfraTec provides high-quality, fast precision lenses for all types of thermographic analysis.

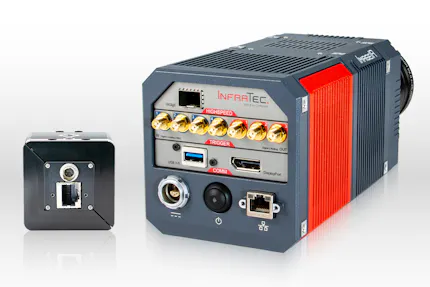
Trigger interface for ImageIR® and TarisIR® cameras

Trigger Interface

Interface for Incoming and Outgoing Control Signals
Trigger signals to or from the camera can be used to control and synchronise image data acquisition. Thermographic measurements can also be used to control processes.

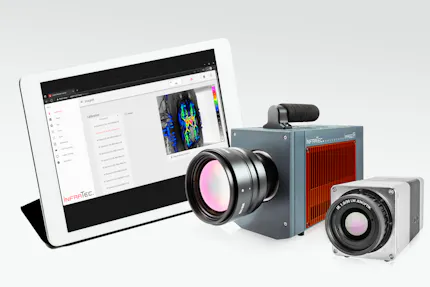
ImageIR® thermographic cameras can be controlled wirelessly and very flexibly via web interface using a smartphone or tablet.

Camera Remote Control

Wireless Measurement – Independent and Convenient

The functions of the stationary camera systems can be controlled via the integrated web interface using a smartphone or software, as well as via an additional tablet attached to the housing.

InfraTec glossary about motor focus

Motor Focus

Remote-controlled Focussing of the Thermal Image

Interchangeable standard lenses in the ImageIR® series can be equipped with a motor focus unit. This enables precise, remote-controlled and fast focussing via the operating software.

InfraTec glossary - Rotating filter- und aperture wheel

Filter & Aper­ture Wheel

Measurement of High Temperatures & Spectral Ranges

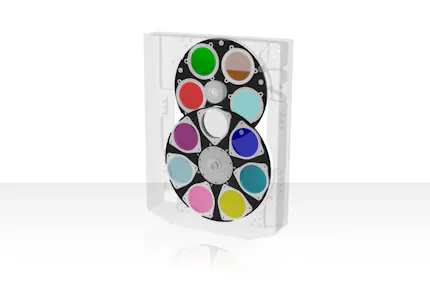
Up to two individually combinable wheels equipped with filters and apertures allow the camera sensitivity to be adjusted to the specific requirements of demanding measurement tasks.

HighSense for thermographic camera series ImageIR®

High­Sense Function

Guaranteed Flexibility and Measurement Accuracy

Due to this innovative feature, the cameras' measurement accuracy remains unchanged even when integration times or measurement ranges are altered. This will save users both time and money.

Camera-specific SDK of the ImageIR® series

On-Board SDK

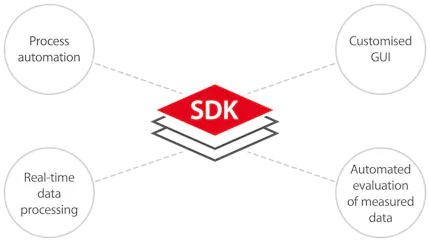
ImageIR® series thermal imaging cameras have recently been equipped with a new generation of electronics. This allows an operating system to be embedded directly into the camera (embedded system). The Software Development Kit integrated into the operating system offers users numerous additional capabilities alongside the familiar advantages of an external SDK.

Relevant Indus­tries & Applic­a­tions

thermal imaging for environmental studies

Envir­on­mental Studies

Look for smallest temperature differences in landscapes, biotopes and labs using infrared camera models of highest measurement precision.

microthermography

Micro-Ther­mo­graphy

Micro-thermography allows for the thermal analysis of smallest structures in the micrometer range, providing a detailed representation of the temperature distribution on complex electronic assemblies.

spectral ir thermography

Spec­tral Ther­mo­graphy

Using precision filters for specific applications you will measure exactly those spectral ranges being of interest to you.

All branches and application areas